Published by Bob Elliott on Jan 1, 2024
Despite prognostications and market pricing of a near certain recession at the start of 2023, the US economy not only avoided a downturn, it thrived. The start of ‘24 is shaping up to be similar. That will be a surprise for many, particularly for bond market investors.
The primary reason for optimism heading into ‘23 came from understanding that while rates had risen aggressively, borrowers were much less sensitive to these rate rises than many expected. That dynamic limited the drag from the Fed’s hikes. The economy was also supported by a range of mini stimulus ranging from investment inspired by the IRA (Inflation Reduction Act) and CHIPS Act, to the subtle support to post-tax incomes from higher social security and lower tax brackets. So while the economy would have been slow to respond regardless, it was the effective fiscal easing steps that helped drive continued strength during the year.
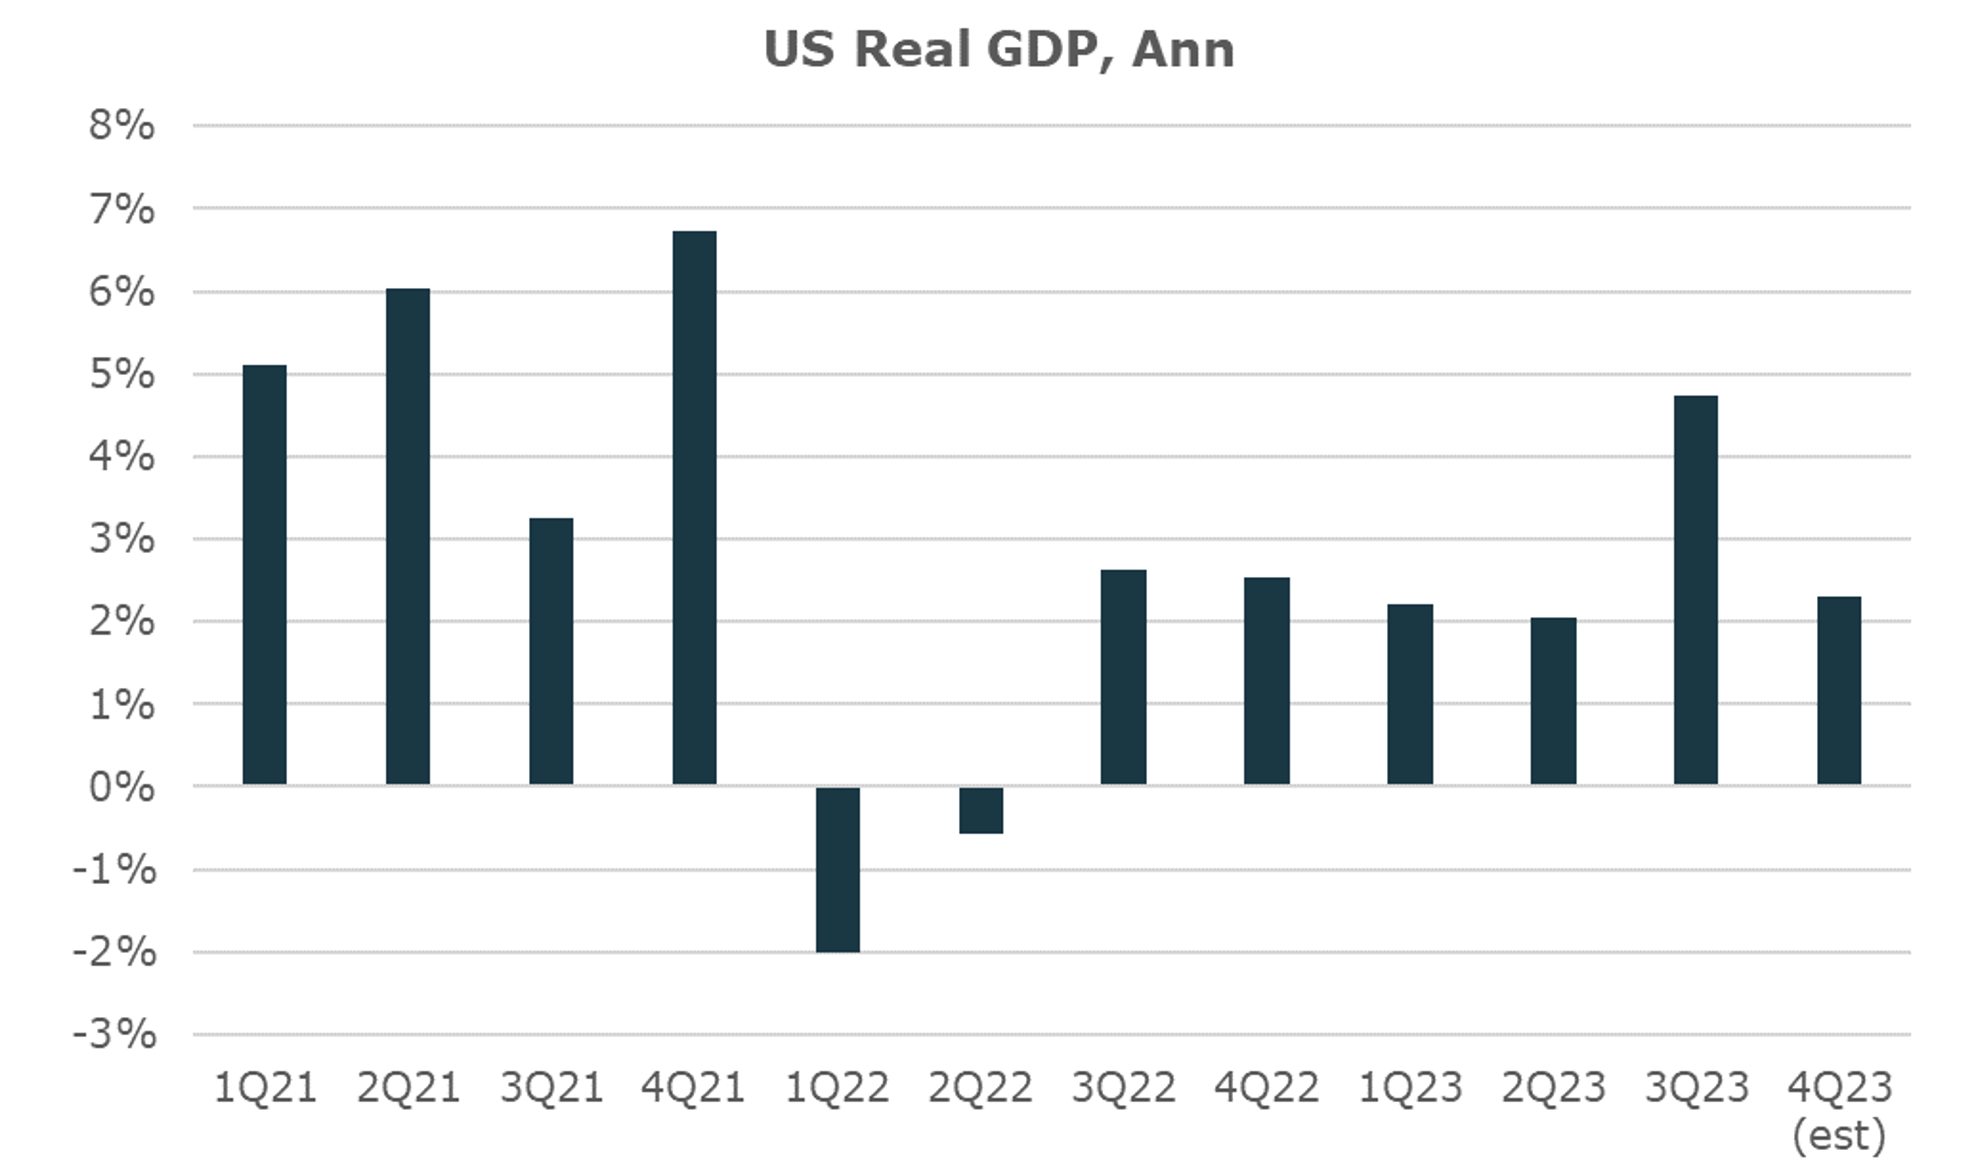
For informational and educational purposes only and should not be construed as investment advice. No Representation is being made that any investment will or is likely to achieve profits or losses similar to those shown herein. Source: FRED and Atlanta Fed
While ‘23 ended up being pretty strong, it was clear from the data that there was underlying slowing happening, across the economy. If this was written at the end of Oct, we’d be focused on how the Fed’s rate hikes and higher long-end rates were having an impact and worried that the cheers of big disinflationary impulses driving inflation lower portended a much weaker deflationary environment ahead.
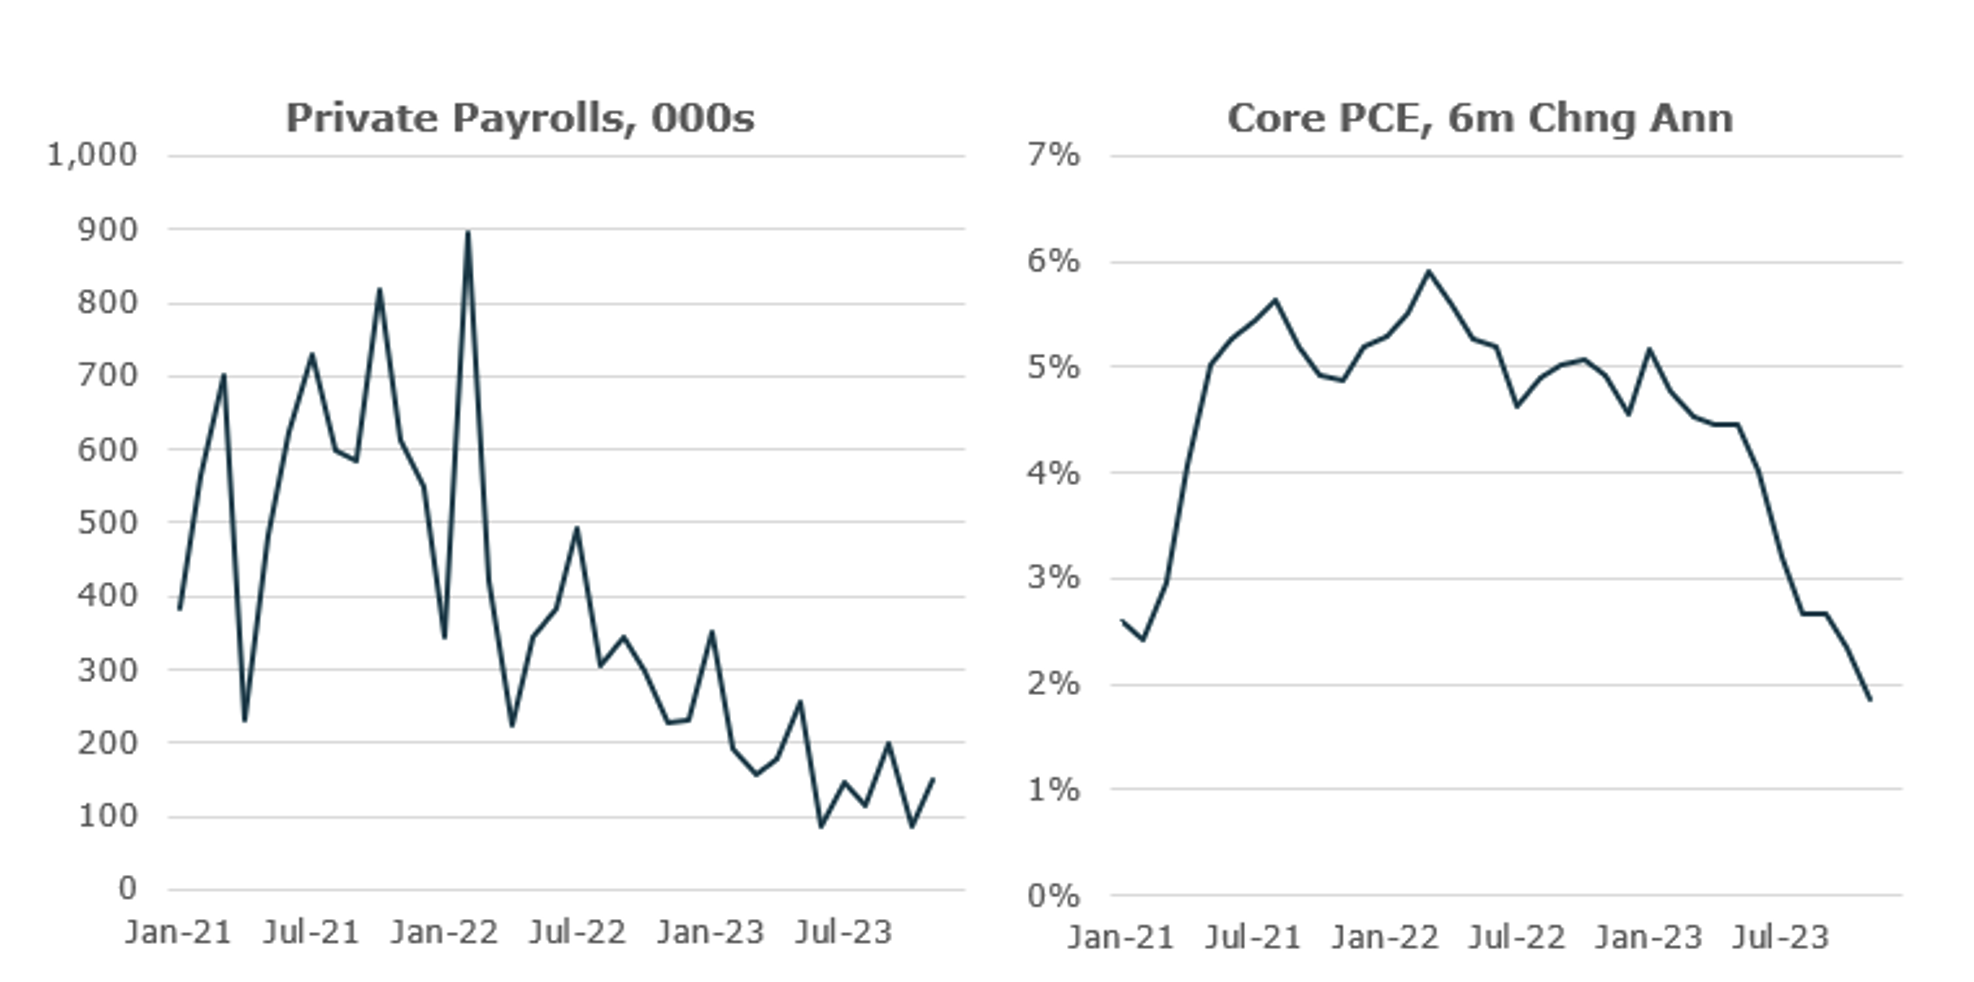
For informational and educational purposes only and should not be construed as investment advice. No Representation is being made that any investment will or is likely to achieve profits or losses similar to those shown herein. Source: FRED
Significant changes came on November 1st. In the span of 6 weeks significant easing steps by the Treasury and Fed (supported by lower inflation data) kicked off a complete reversal of the tightening of financial conditions that occurred over the summer. As of late December, long-term bond yields are back to where they were at the start of ‘23 and stocks are nearly 25% higher. Adding to it, gas prices are now a dollar lower per gallon.
Taken together, the US economy is experiencing one of the largest effective easing shocks during a late cycle point of the cycle in decades (akin to ‘98). Combined with the underlying decent momentum already, this should be more than enough to keep the economy going well into the start of ‘24.
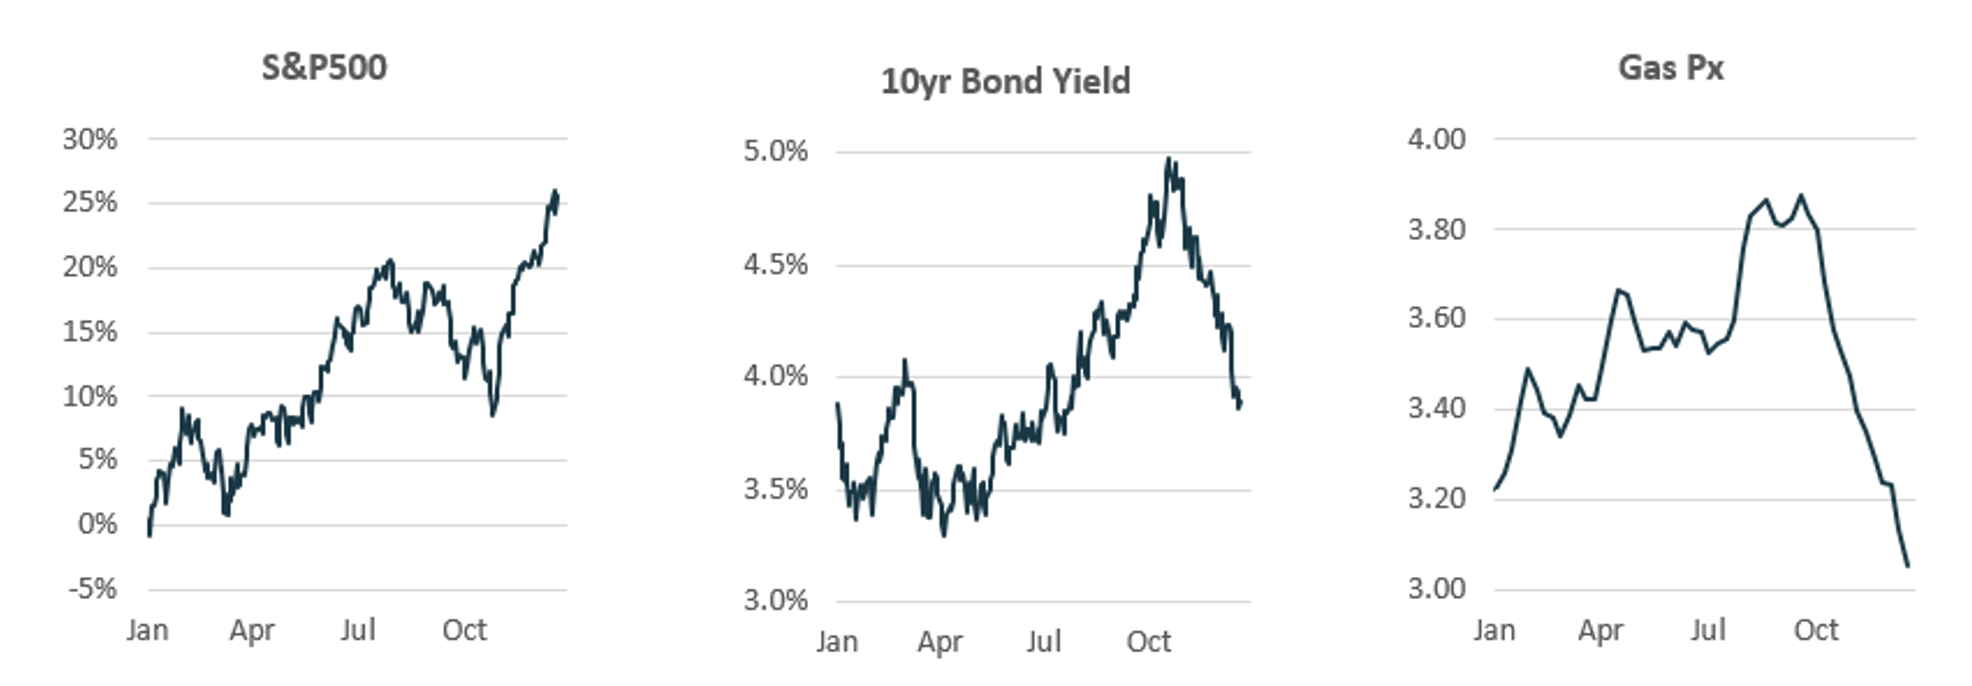
The results depicted herein are aggregated index results and do not represent returns any investor achieved. Indexes are unmanaged and investors cannot invest directly in an index. Performance data shown represents past performance and is no guarantee of future results. Source: Yahoo Finance and FRED
Despite this straightforward set of dynamics, markets are pricing in widely divergent outcomes. Short rate markets are pricing in 7 cuts by the end of ‘24; the options pricing suggests a >30% chance of rates being below 3% by year end; and risk-matched bonds have outperformed stocks by 5% in the last 6 weeks. The cuts priced into the market are more than 2x more aggressive than the adjustment cuts indicated by the Fed in their dot plot at the December meeting. Further, oil remains weak coming just off 6-month lows. If you were just looking at these measures you’d think that the economy was on the precipice of a collapse.
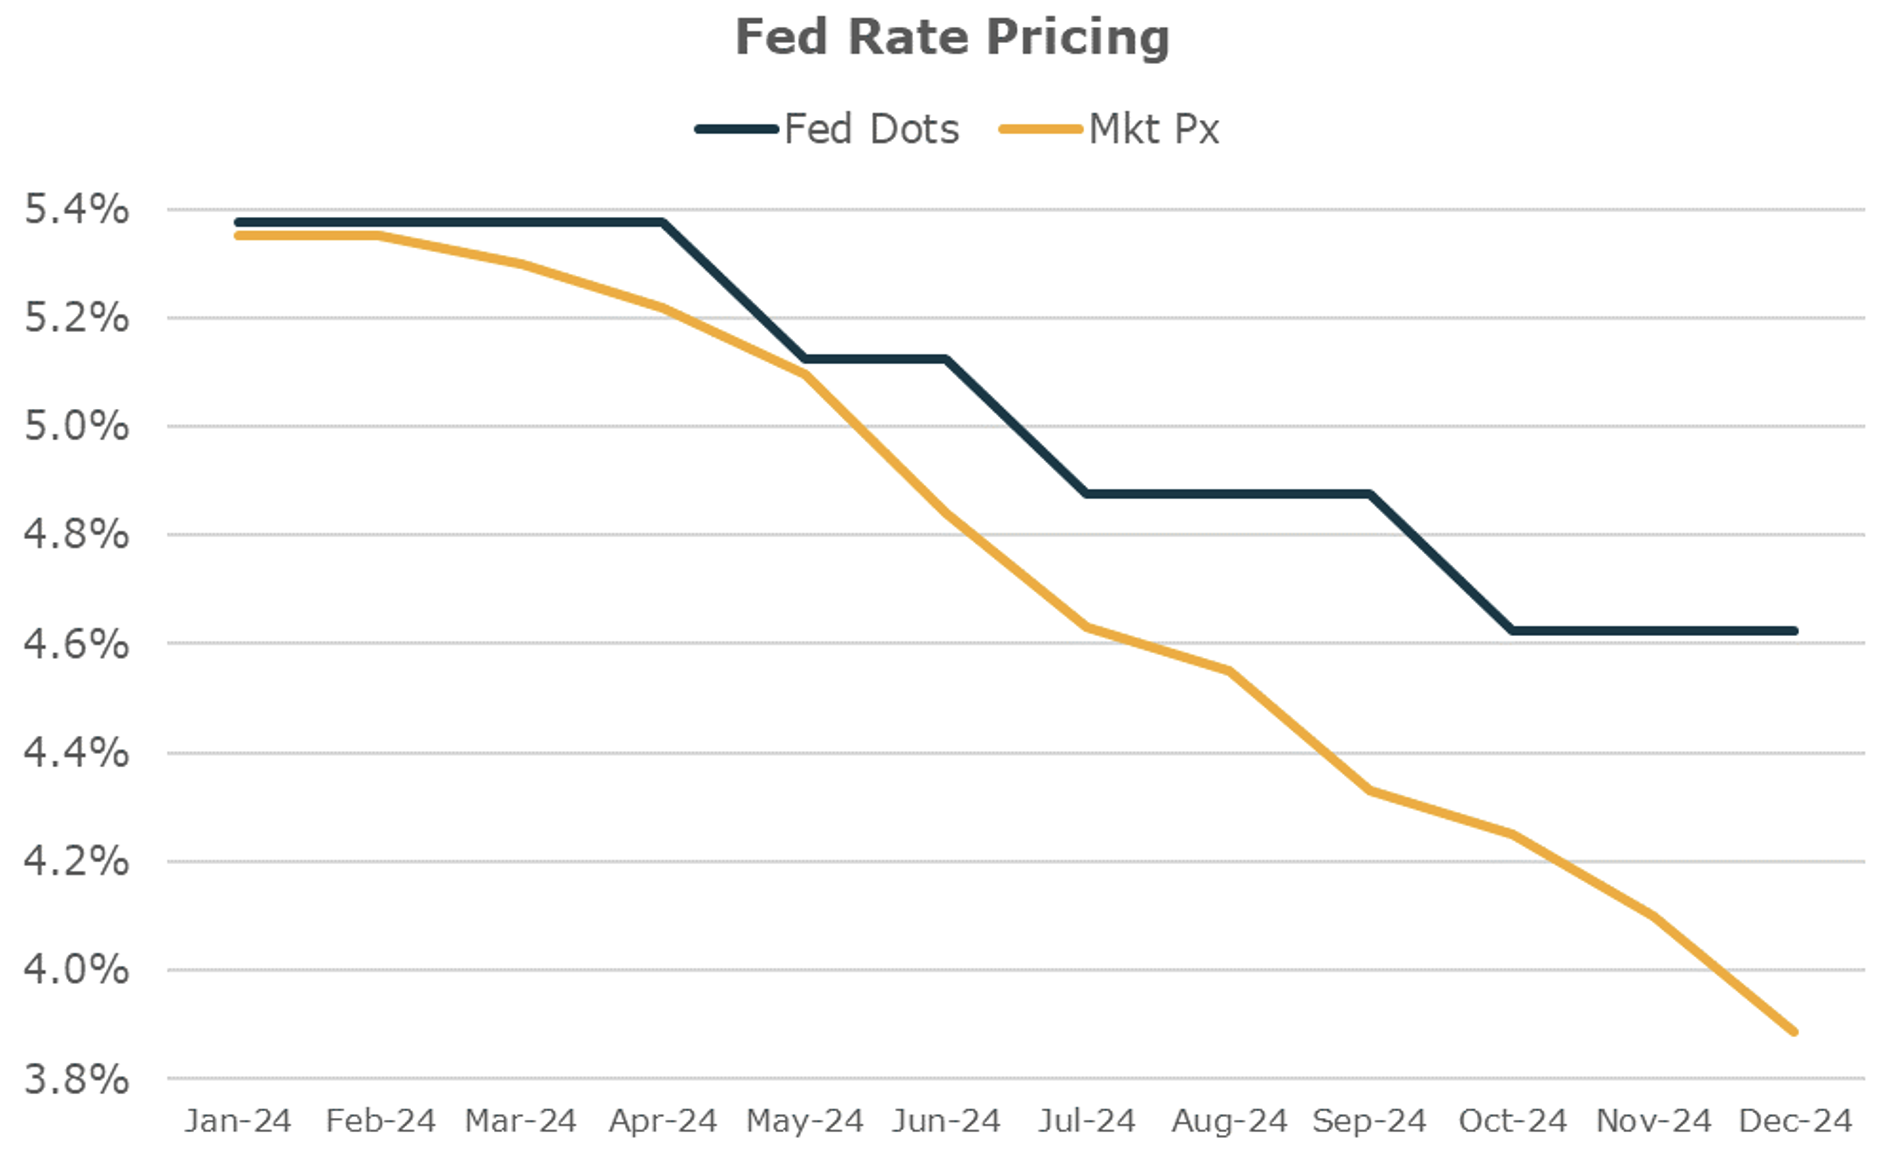
For informational and educational purposes only and should not be construed as investment advice. No Representation is being made that any investment will or is likely to achieve profits or losses similar to those shown herein. Source: Federal Reserve and Bloomberg
In contrast, stocks are making new highs, the most challenged companies this cycle are rallying hard, and nearly every credit spread is putting in lows for the year.
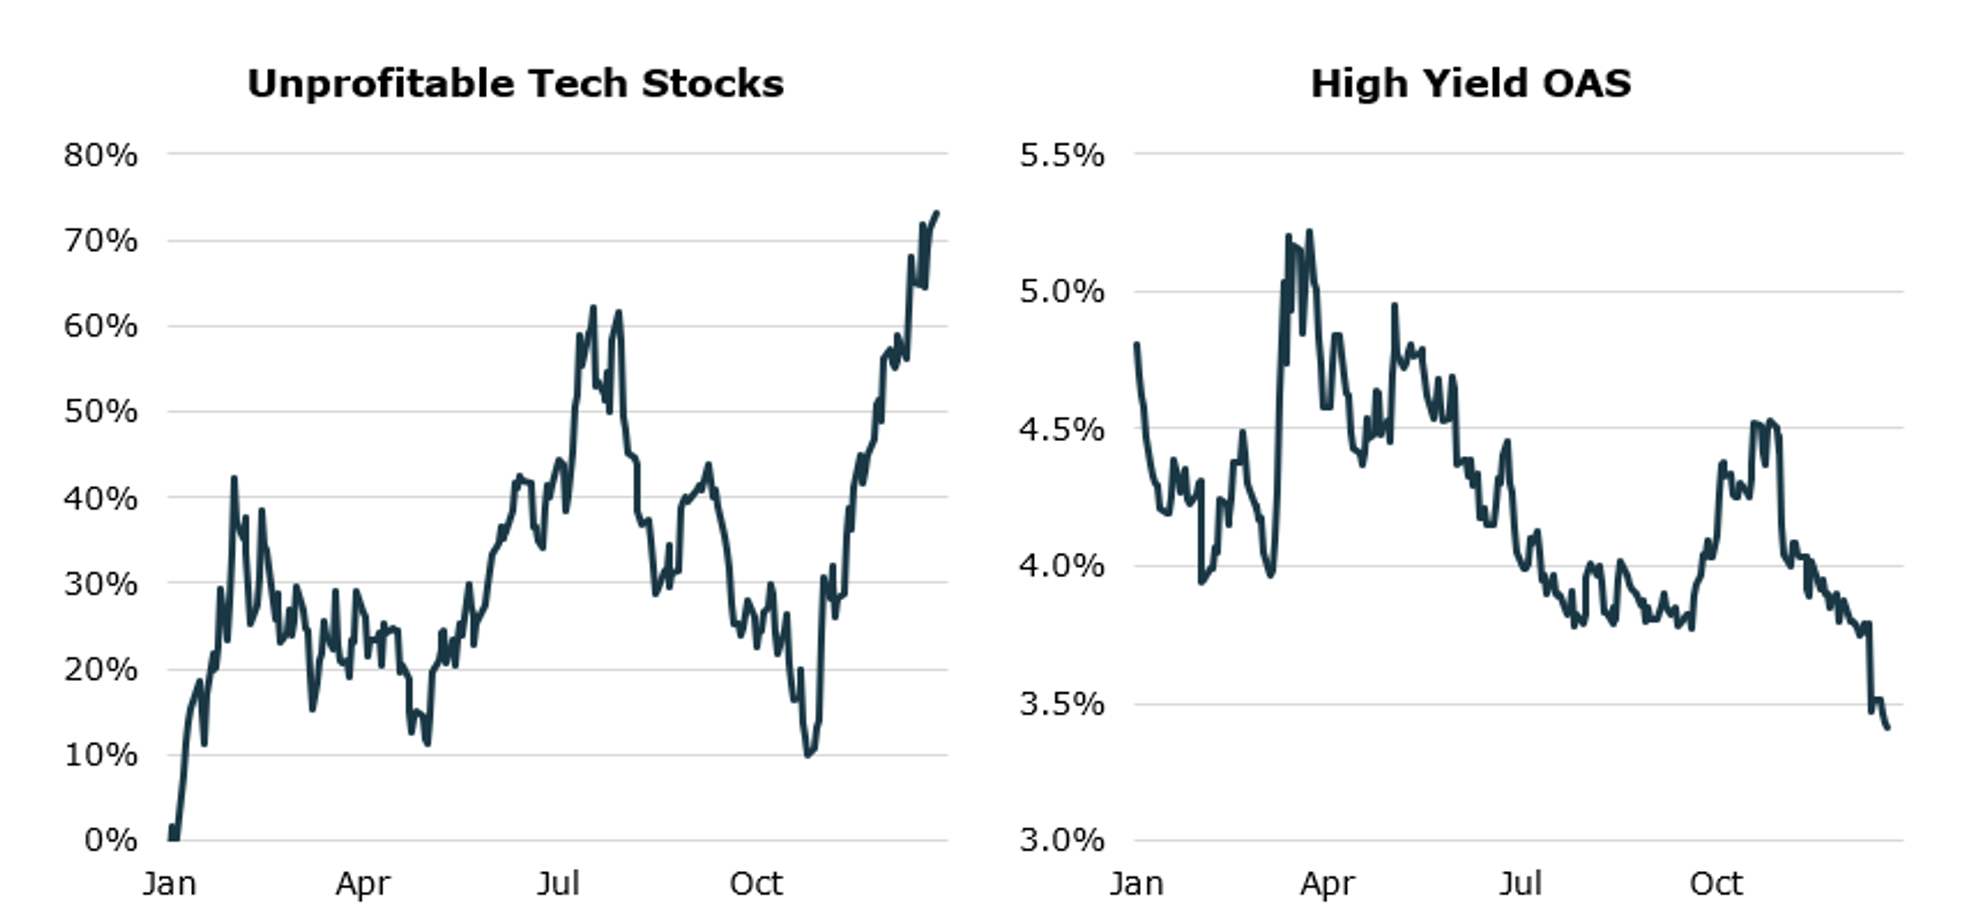
For informational and educational purposes only and should not be construed as investment advice. No Representation is being made that any investment will or is likely to achieve profits or losses similar to those shown herein. Source: Yahoo Finance and FRED
One of these views is unlikely, and from the mechanics at play, it looks more likely that the recession worries will not be realized. While declining inflation pressures have opened the door for the Fed to do some mid-90s style adjustment cuts, getting 6-7 cuts next year would require a substantial collapse in economic conditions that is unlikely given the current economic momentum and recent easing. Pricing of slower growth conditions in recent weeks – with long-term bonds outperforming stocks – is likely to reverse as data comes in suggesting continued strength.
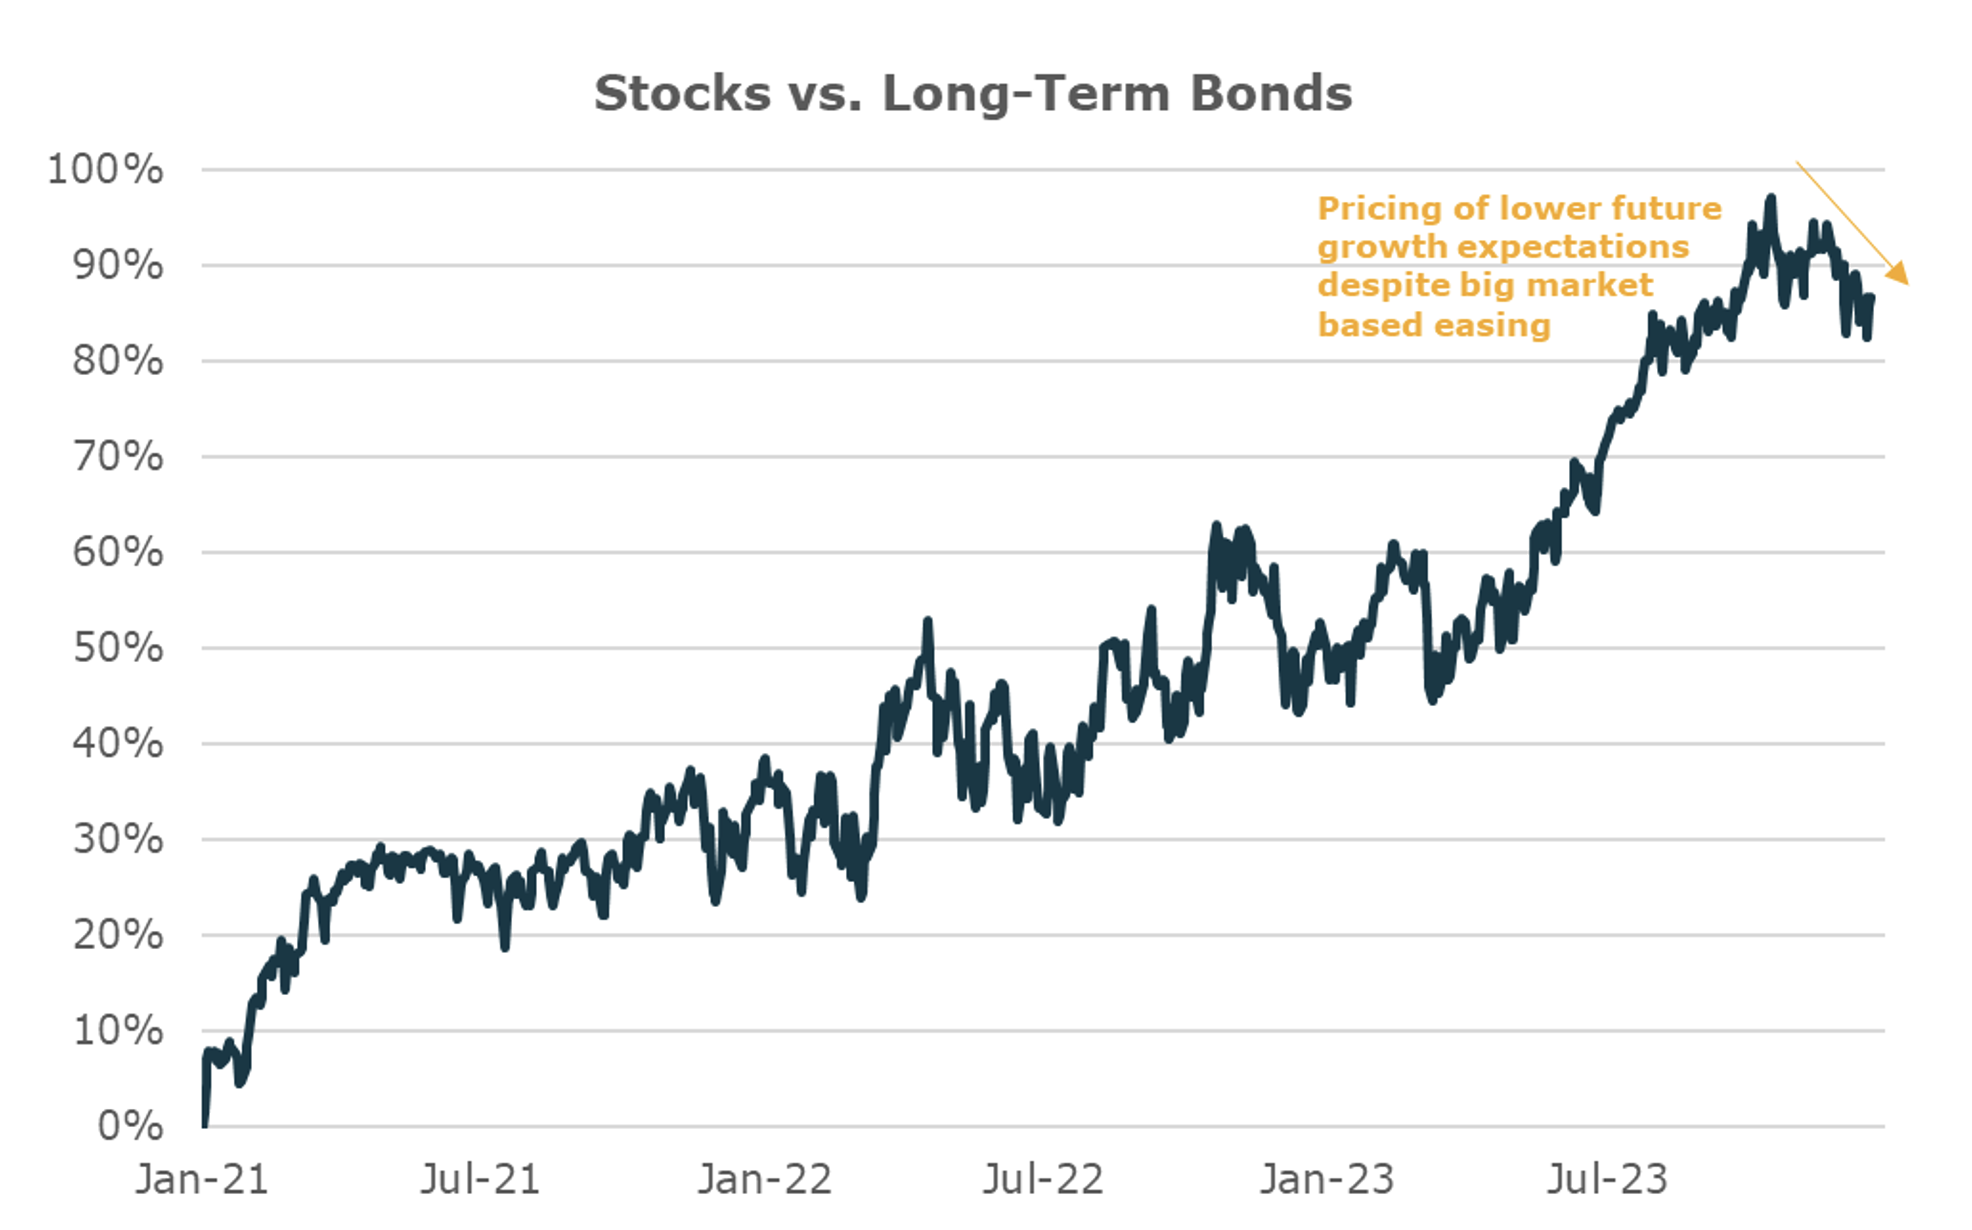
The results depicted herein are aggregated index results and do not represent returns any investor achieved. Indexes are unmanaged and investors cannot invest directly in an index. Performance data shown represents past performance and is no guarantee of future results. Source: Yahoo Finance
The market cap weighted stock market has reached nominal highs on a total return basis and it will prove difficult for the best performing stocks in ‘23 to meet elevated expectations in ‘24, even with growth coming in stronger than many expect. But there are a lot of stocks that are still significantly below all-time highs reached in late ‘21 that could benefit from elongated economic strength. Most likely the repricing in stocks will come from the small and worse performers, rather than those who made the headlines in ‘23.
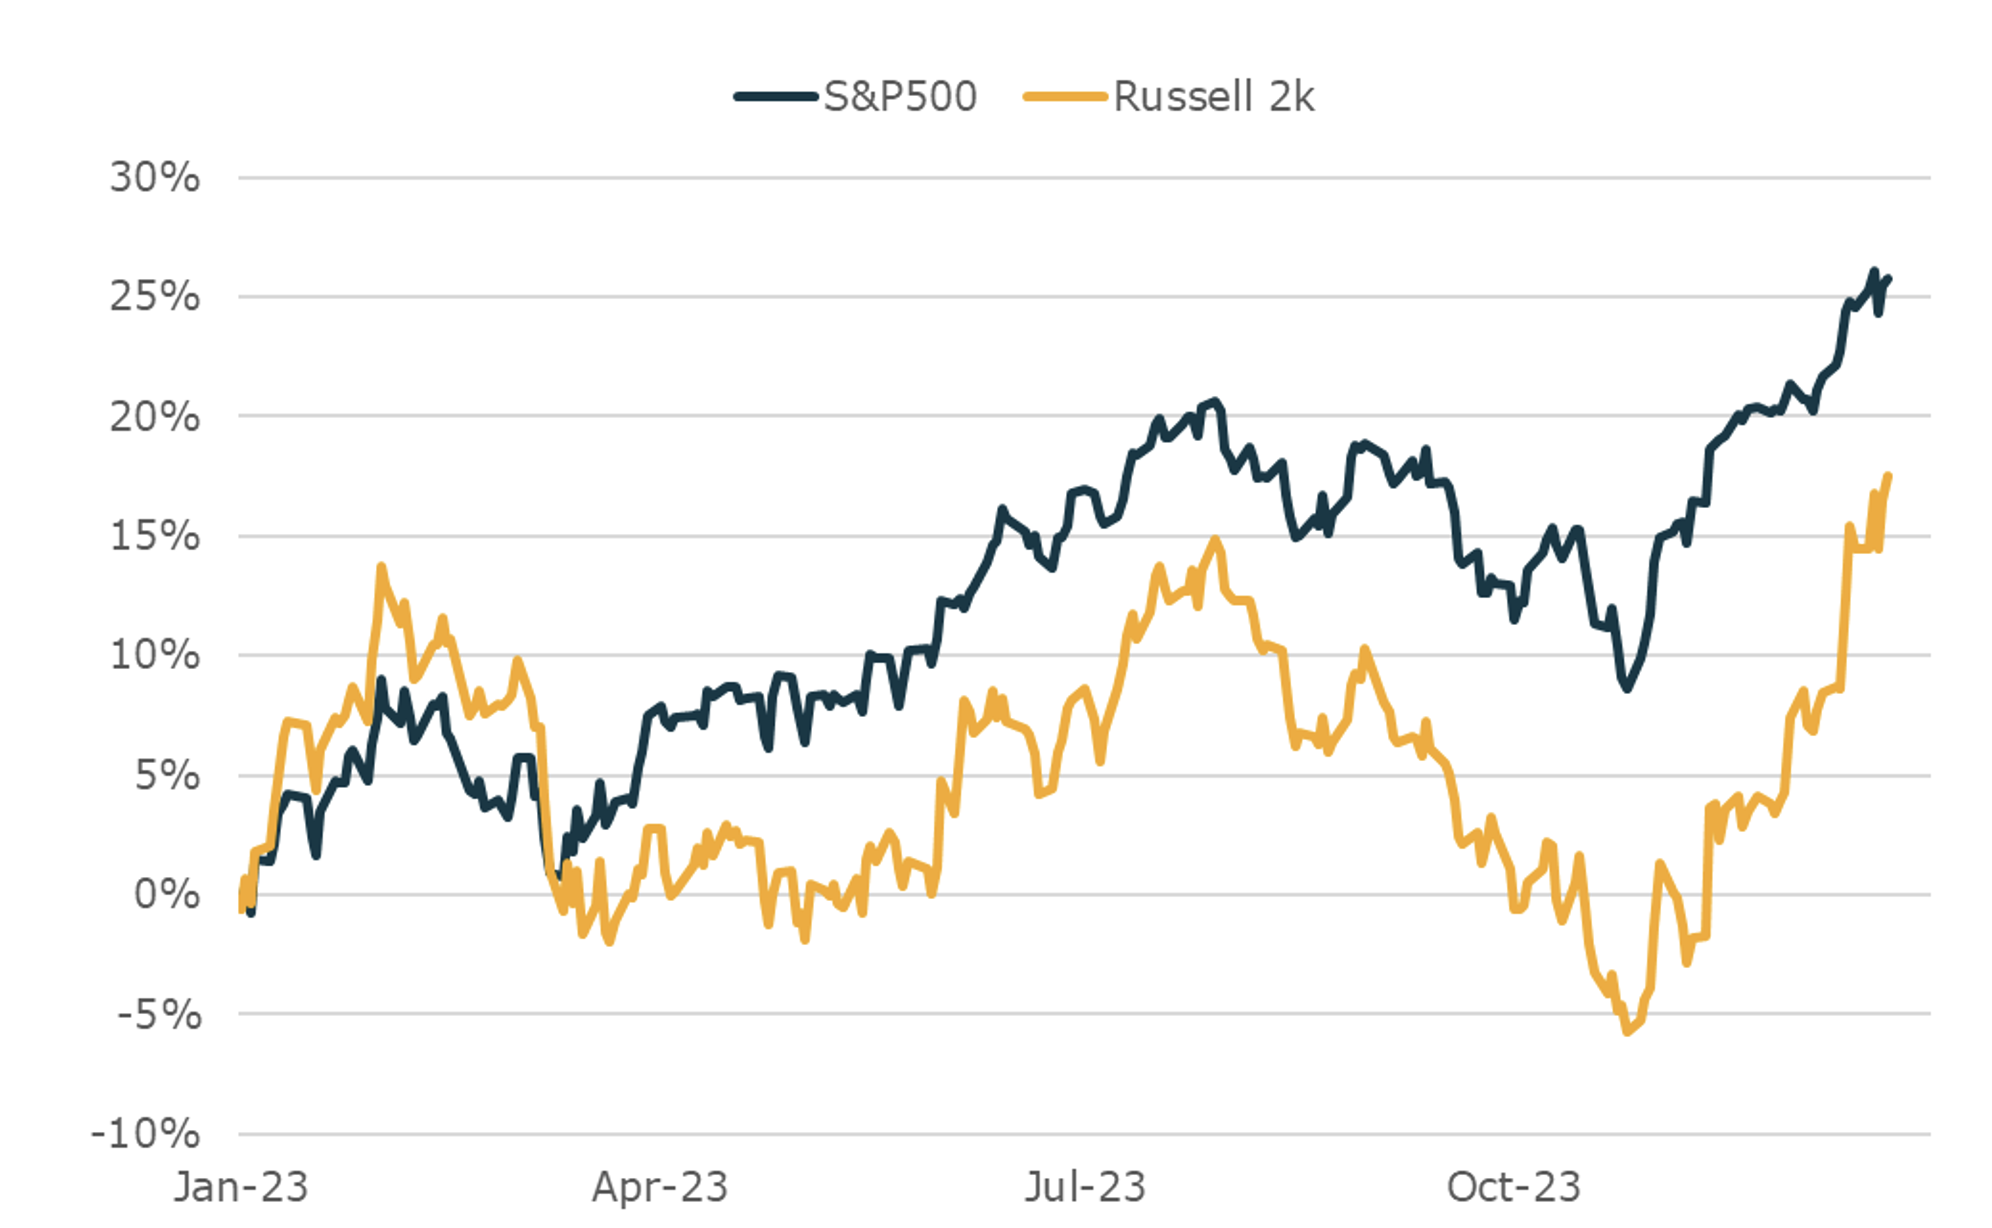
The results depicted herein are aggregated index results and do not represent returns any investor achieved. Indexes are unmanaged and investors cannot invest directly in an index. Performance data shown represents past performance and is no guarantee of future results. Source: Yahoo Finance
Since the start of the tightening cycle markets have priced in several relatively extreme waves of future expectations while the real economy has experienced a fairly steady expansion. Just think, in ‘23 we’ve seen the following consensus expectations, that have whipped from one side of the narrative to the other:
- Immediate recession (Dec ‘22)
- Higher for longer (Jan/Feb)
- Deflationary credit crunch (Mar/Apr)
- Productivity miracle (May/Jun/Jul)
- Even higher for longer (Aug/Sep/Oct)
- Mega easing (Nov)
- Weakening growth and inflation with big easing (Dec ‘23)
For many years in the QE era, aligning with trends at the first sign of reversal was one of the best ways to trade, since so much was driven by incremental Fed policy driving shifts in economic and market conditions. The dynamics today are markedly different, with a real economy that is relatively stable, independent of the Fed’s actions. Fading extreme pricing has been a much better trade in recent years than using it to call the turn.
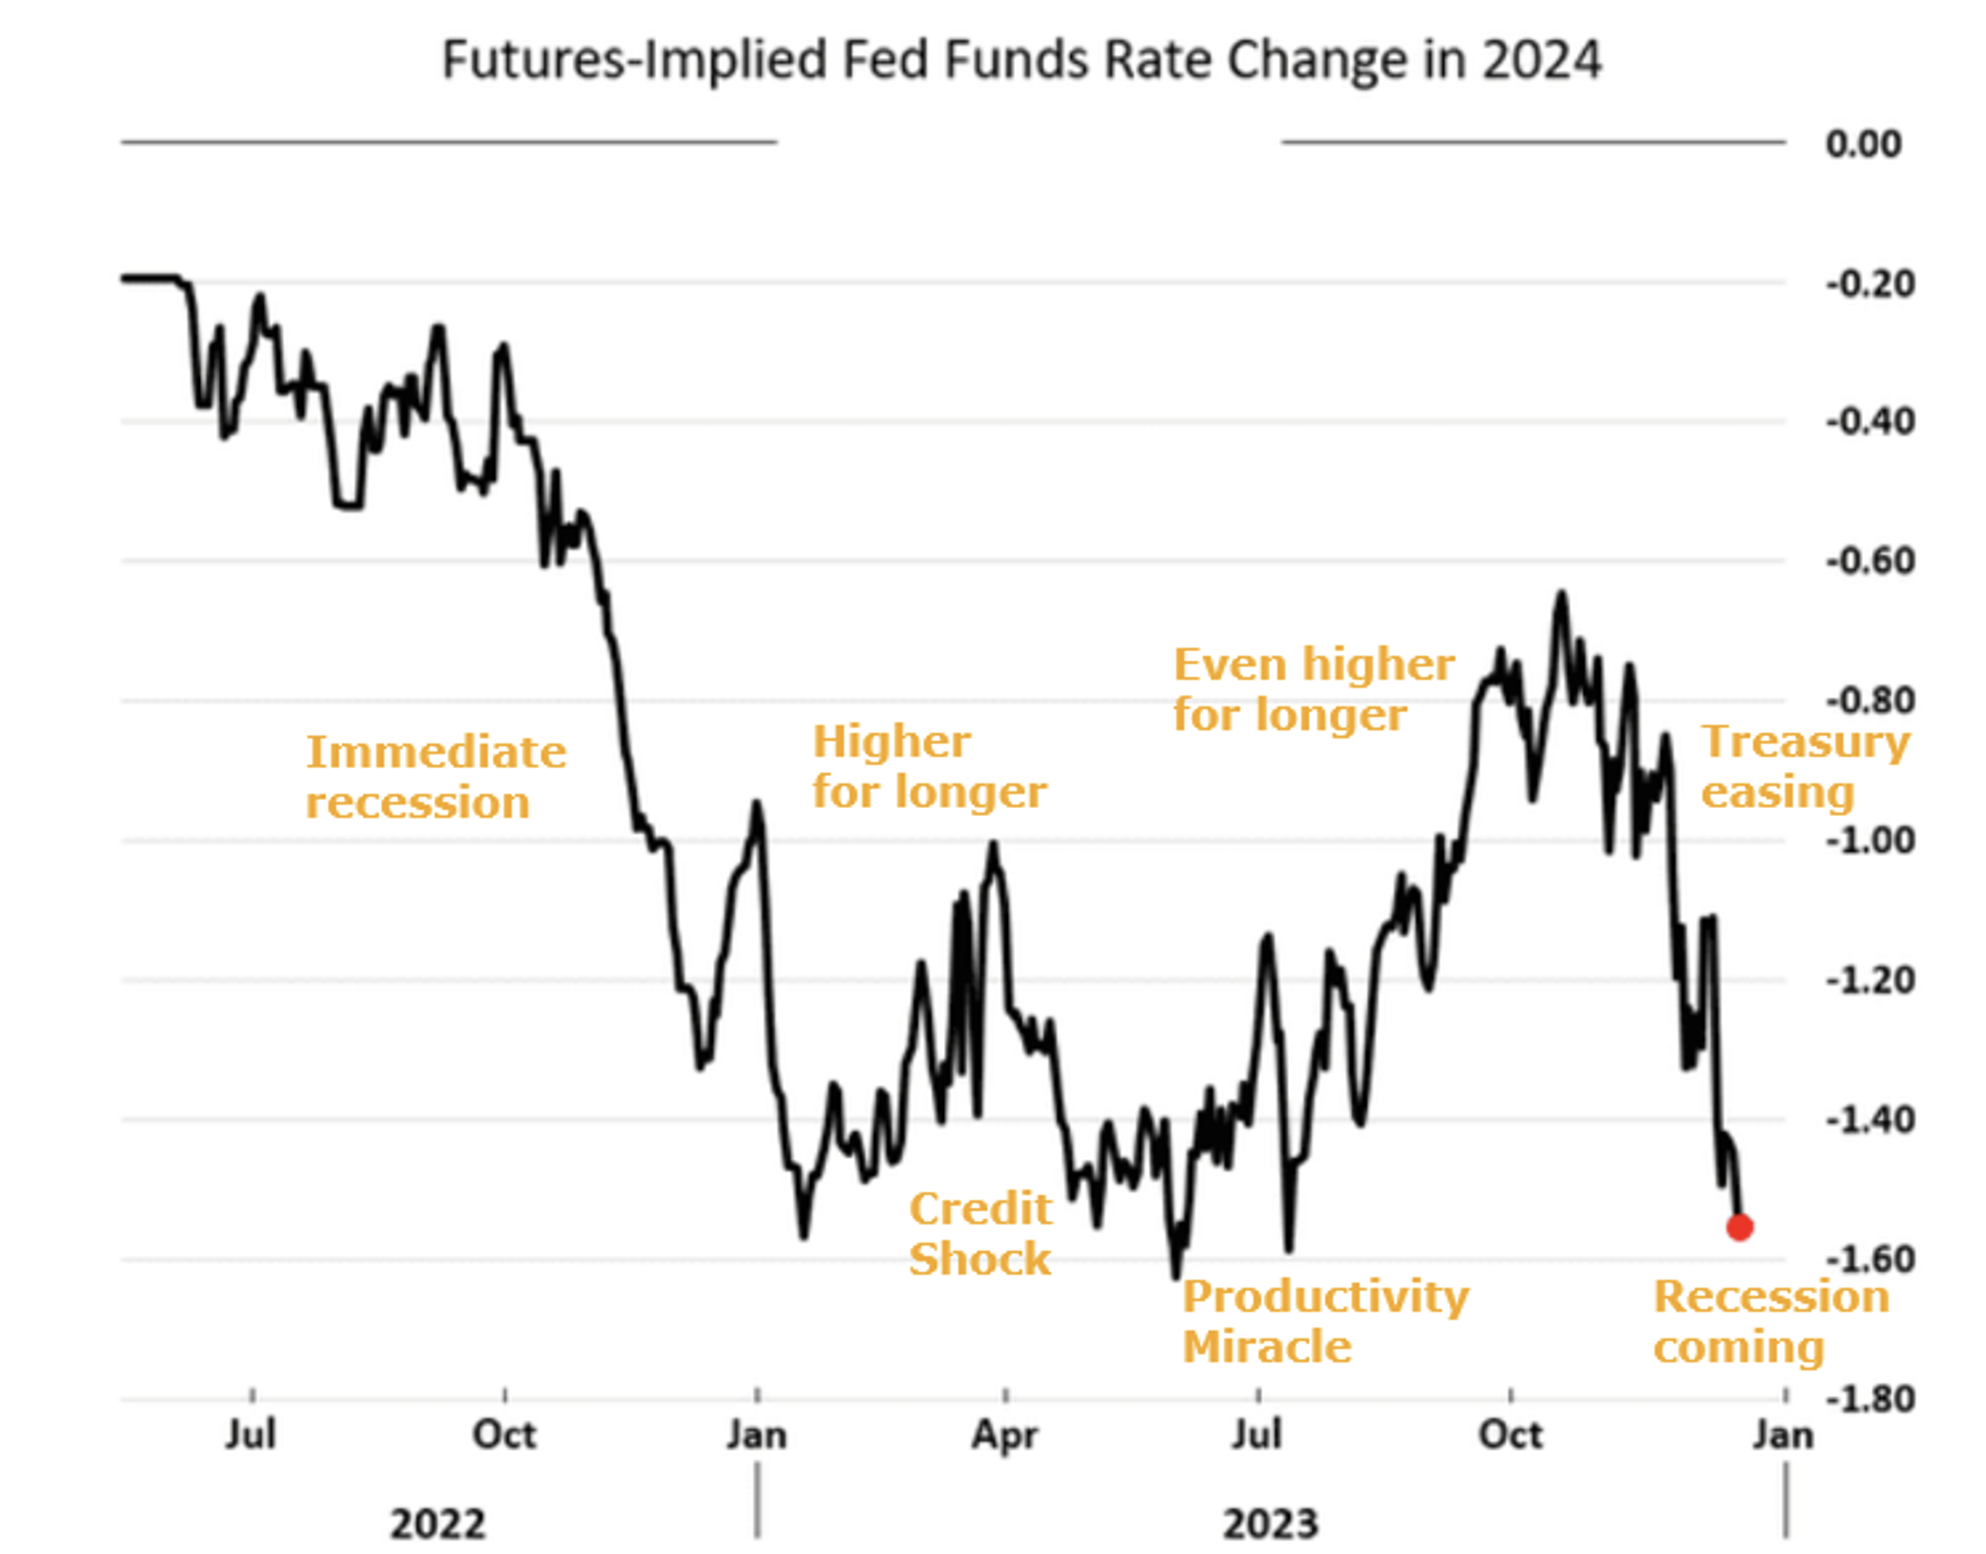
For informational and educational purposes only and should not be construed as investment advice. No Representation is being made that any investment will or is likely to achieve profits or losses similar to those shown herein. Source: The Daily Shot and Unlimited
Probably the most confident prediction then for ‘24 is that we will see more of the same, with volatile pricing of shifts in conditions and much slower moving reality. As we head into ‘24 market pricing looks most extreme relative to likely conditions in the bond and short-rate markets, making those assets the best to fade, or trade against. But at some point that pricing will likely be resolved and a new extreme pricing will emerge to fade (for instance far too bullish). And then pricing will likely move back in the other direction again. Navigating these markets well will require the discipline to understand what is priced in, relative to the probabilistic outcomes, combined with the agility to respond when mispricing emerges.
So while it looks like stronger for longer is mostly likely to dominate, the our advice is to stay flexible. If ‘24 is anything like ‘23, it’s going to be another volatile time for generating alpha.
For informational and educational purposes only and should not be construed as investment advice. The historical analysis discussed herein has been selected solely to provide information on the development of the research and investment process and style of Unlimited. The historical analysis should not be construed as an indicator of the future performance of any investment vehicle that Unlimited manages. No investment strategy or risk management technique can guarantee return or eliminate risk in any market environment. No Representation is being made that any investment will or is likely to achieve profits or losses similar to those shown herein.
