By Bob Elliot and Nathan Nangia Sept 16, 2024
As this cycle becomes long in the tooth, many allocators are evaluating whether their portfolios may be underweight managers that perform well during turbulent market environments. It’s often during these types of environments that manager dispersion is its greatest, therefore finding funds that consistently outperform in down markets could present the opportunity to differentiate portfolio returns.
The trouble is that consistent outperformance across consecutive stressed environments is quite rare, suggesting that even strong performance in past down markets may be unlikely to portend strong returns in a similar environment in the future. Further, in many cases, allocating to managers that have successfully navigated past turbulent times generally comes with meaningful return drag over time, as these managers often underperform during subsequent better market environments.
While the opportunity to generate allocation alpha seems particularly attractive during these times, diversification through indexing appears to produce more attractive returns over time than trying to pick winners when storms appear to be approaching.
Challenging Market Environments Drive Greatest Manager Dispersion
Allocators may be tempted to try to pick managers that promise improved convexity in down market environments since those can be periods where manager dispersion offers the potential for differentiated returns.
The charts below show a measure of performance dispersion in monthly returns by individual strategy style as measured by the interquartile range (i.e., the difference between the top quartile and bottom quartile). Periods of higher dispersion seem to afford more meaningful opportunities to create differentiated allocation alpha. As the charts show, the biggest periods of dispersion through time appear to coincide with challenging market conditions.

Source: Preqin Data and Unlimited Calculations.
Few Managers Consistently Outperform During Stress Periods
Significant dispersion during these drawdown periods attracts allocators who perceive opportunities to generate differentiated portfolio returns in challenging market environments by picking managers that have a track record of strong performance during historical drawdowns.
The trouble is few managers *consistently* outperform during successive stressed periods. To get a sense of the challenge of finding consistent outperformers during these periods, we evaluated the number of funds that generated a top quartile return during a given drawdown period and the intersections with other periods. The results highlight the difficulty of selecting funds that consistently outperform during drawdowns.
Intersection of Top Quartile Monthly Return During Drawdown Periods

Note: The chart shows the number of funds unique to that intersection only. Therefore, an intersection of three periods can be smaller than an intersection of four periods if the latter set contains most of the elements in the former. Source: Preqin Data and Unlimited Calculations.
Consistent meaningful outperformance is rare during stressed periods, and likely no better than random chance across various intersecting periods. Despite the allure of picking managers well equipped to navigate drawdowns, consistently capturing alpha during those times is improbable.
The Costs Of Allocating To Managers That Previously Outperformed During Challenging Times
Most allocators face the trade-off between the benefits of diversification (which are generally well understood) with the potential for allocation alpha, which is uncertain. For those allocating to funds in pursuit of drawdown “protection”, generating alpha comes down to 1) can the funds *consistently* outperform during those periods and 2) do those funds create return drag during normal times.
As described above, on point (1) it is difficult to find funds that consistently outperform, relative to random chance. The pursuit of tail risk strategies can be even more tumultuous since those that performed well in the previous downturn often have a bias that can cause them to underperform subsequently once the turmoil ends, causing them to fall short on (2) as well.
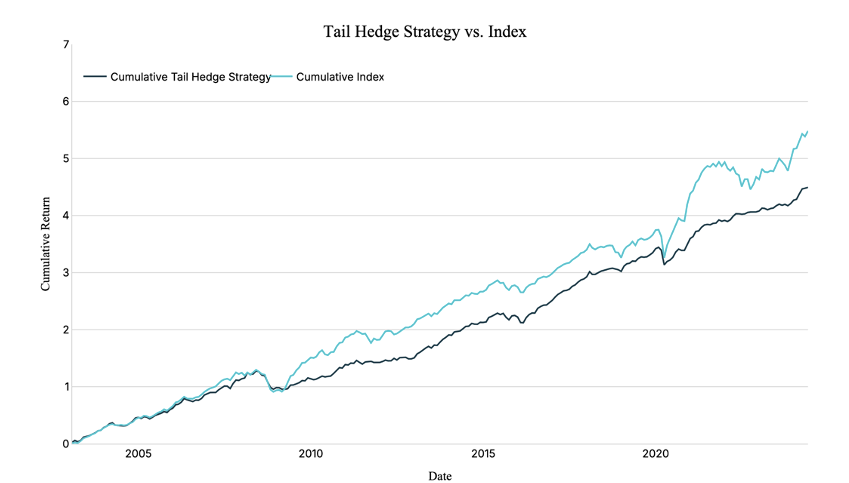
To offer some perspective on this, we utilized Preqin data to show a simple tail-hedge allocation strategy – defined as investing in funds that were top quartile of return during the last drawdown and holding them until the end of the next drawdown – compared with an index strategy, investing in all hedge funds reporting to Preqin. The results indicate that tail-hedge allocations typically trail the performance of the index post-market turmoil. The effect is compounded by performance in the period subsequent to the drawdown.

The index referenced herein represents a bottom-up aggregation of hedge fund data reported to Preqin. The material is based upon information which we consider reliable, but we do not represent that such information is accurate or complete, and it should not be relied upon as such. Source: Preqin Data and Unlimited Calculations.
Today, tail hedge strategies frequently offer suboptimal “protection” throughout a cycle and those that do often underperform in the next cycle. Consequently, it would seem allocators may achieve a better outcome by simply taking an index approach to investing and focusing on other ways to improve returns – in particular from lower fees.
For informational and educational purposes only and should not be construed as investment advice. The historical analysis discussed herein has been selected solely to provide information on the development of the research and investment process and style of Unlimited. It does not constitute an offer to sell or a solicitation of an offer to buy any security. Opinions expressed are our present opinions only. No Representation is being made that any investment will or is likely to achieve profits or losses similar to those shown herein. No investment strategy or risk management technique can guarantee return or eliminate risk in any market environment. The material is based upon information which we consider reliable, but we do not represent that such information is accurate or complete, and it should not be relied upon as such. Certain limitations exist in any self reporting data, including Preqin Hedge Fund dataset used as the basis for this analysis. The historical analysis should not be construed as an indicator of the future performance of any investment vehicle that Unlimited manages.
