
Published By Bob Elliott and Nathan Nangia on August 6, 2024
Last year, we wrote a piece evaluating hedge funds’ performance persistence and its implications on allocators’ ability to select managers. Our conclusion was straightforward: individual hedge fund manager outperformance is not persistent relative to the overall Hedge Fund index. Therefore, a randomly selected portfolio of funds would perform as well as an allocators’.
While we looked at the industry as a whole in the previous work, a common point of discussion was the potential for persistence *within* hedge fund strategies. For example, some may argue that proprietary research processes explain a long/short manager’s strong performance and therefore, persistence should exist for long/short managers but not across the board. It’s easy to imagine similar arguments – “better data”, “experience”, “culture”, etc. — for other hedge fund strategies.
So, armed with a larger Preqin dataset, we revisited the topic. When each hedge fund is compared only to other funds running the same type of strategy, the probability of that fund persistently outperforming the median (or top quartile) still aligns with random chance. And even popular approaches like picking the highest risk-return strategies haven’t historically beat the index over time. The conclusion suggests allocators could focus less on trying to pick the “best” funds and more on diversification and reducing fee expense.
Hedge Fund Outperformance Persistence Is No Better Than Random Chance
The effort started by evaluating how often top-performing funds in a given year would continue to be top-performing in subsequent years. To calculate the persistence probabilities for year 1, we counted the number of funds that were over the median (and top quartile) rolling 1-year sub-strategy return for every month since 2008. We then divided this number by the number of funds in that sub-strategy. For year 2, it was the number of funds that were over the rolling 1-year median (or top quartile) and year 1’s median (or top quartile); we repeated this process for years 3, 4, and 5. Finally, we took the mean of all the month’s probabilities to visualize the data. If manager outperformance persisted, you’d expect to see the year-to-year frequency to be above the random chance line. Instead, across all strategies, the results are largely consistent with a dart throw.
Survivorship bias does not appear to improve allocators’ chances. Including ‘dead funds’ would increase the number of funds (the denominator) while leaving the number of funds above the median (the numerator) unchanged. Removing the ‘dead funds’ is the most conservative and favorable approach, so we did just that. Likewise, we removed dates with fewer than 20 funds in a given strategy, to promote robustness.

Some allocators may also claim that returns are a bad metric – we should be considering risk-adjusted returns. To appease these critiques, we’ve conducted a similar analysis but considering the persistence of a normalized Sharpe ratio. The evidence still points towards fund performance being random year-over-year.

Next, we explored the performance of funds in the years following top-quartile returns. Specifically, we analyzed the distribution of funds’ performance in years 1-5 conditional on top quartile performance in year 0. Our analysis again shows that marked-to-market funds disperse randomly. In fact, for some strategies, they appear marginally more likely than expected to be in the bottom quartile one year after being in the top quartile. However, as with other asset classes, there may be marginal persistence for strategies trading highly illiquid assets. Again, we ignored funds that stopped reporting returns or ‘died.’

Allocators looking at this analysis may be tempted to argue that there is persistence within strategies. We acknowledge that there is weak evidence of persistence for some strategies, but there are three caveats:
- Strategies with some outperformance (potentially due to random chance) often correlate with the smallest sample size. We’ve seen evidence of alpha decay – that is, as sample size increases, persistence declines.
- Strategies with marginal persistence seem to overlap with strategies more prone to “smoothed” returns. Credit, multi-strategy, and relative value funds often trade illiquid securities that are challenging to value at times and may be valued at the manager’s discretion. As a result, these assets may be valued in a way that overstates short-term performance or minimizes volatility.
- Traditionally, mature hedge fund portfolios are often multi-strategy, to minimize the variety of risks that allocators may face (operational, sub-strategy outperformance, asset class outperformance, etc.). Persistence differences net out; funds that outperforms in one sub-strategy are likely to be offset by an underperformer in a different strategy.
Since Manager Outperformance Persistence Seems Elusive, It’s Challenging to Build Index Beating Hedge Fund Portfolios
To demonstrate the impact of our conclusions at the hedge fund portfolio level, we constructed a simple active strategy: every year, invest in that year’s above median managers, hold them for the next year in an equally weighted portfolio, and then repeat. While this rebalancing frequency and position sizing method aren’t fully representative of allocators’ toolkit, the result is illustrative. Then, we compared this with an index approach: invest equally in all funds. The index approach performs as well if not better than the active strategy in a large majority of cases.

But very few allocators would likely only look at the previous year’s returns. Instead, a common approach among allocators is investing in those funds with the best risk-adjusted long-term track records. To simulate this more mature hedge fund portfolio, we compared a strategy that invests in funds with Sharpe ratios in the top quartile to the index over the previous 5 years across all strategies at the start of each year. The transaction costs of investing and redeeming dilute the practicality of this investment approach, but it produces an attractive tracking of a common allocation approach.
The troubling aspect is historical data suggests it doesn’t always outperform simple index investing over time. Investing significant effort to identify the “best” yields similar results to a more passive, diversified approach.

The analysis reveals a sobering pattern: the pursuit of consistently selecting outperforming hedge fund managers is akin to random chance. The data suggests despite rigorous analytics and investment processes, allocators may face difficulties building a portfolio of hedge funds that outperforms random chance.
Footnote – Sample Size
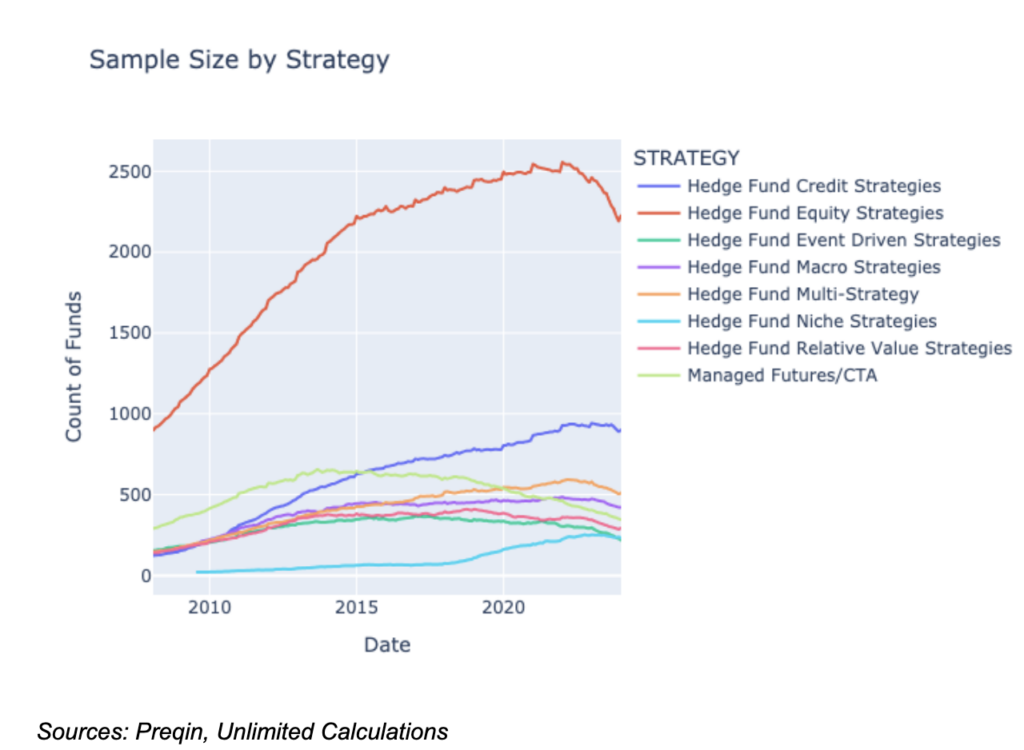
We based our analysis on funds from 1/1/2008 onwards to ensure a sufficient sample size. All months with fewer than 20 unique funds were excluded. Declines in recent years could be due to incomplete (and/or slow) reporting by fund managers to Preqin, rather than an actual decline in managers. Their inclusion would seem likely to bolster our conclusions – since underperforming funds may be inclined to delay voluntary reporting.
For informational and educational purposes only and should not be construed as investment advice. The historical analysis discussed herein has been selected solely to provide information on the development of the research and investment process and style of Unlimited. It does not constitute an offer to sell or a solicitation of an offer to buy any security. Opinions expressed are our present opinions only. No Representation is being made that any investment will or is likely to achieve profits or losses similar to those shown herein. No investment strategy or risk management technique can guarantee return or eliminate risk in any market environment. The material is based upon information which we consider reliable, but we do not represent that such information is accurate or complete, and it should not be relied upon as such. The historical analysis should not be construed as an indicator of the future performance of any investment vehicle that Unlimited manages.