
Published By Bob Elliott and Nathan Nangia on February 18, 2025
Allocators have many sources of alpha, but three are often touted as signs of skill: 1) timing, 2) sizing, and 3) manager selection. That is, many allocators claim that they can either 1) time their allocations opportunistically, 2) manage position sizes such that they have an “optimal portfolio of risky assets”, or 3) invest with the best managers. Independently, all of these levers are powerful and, theoretically, any one of them should allow allocators to consistently outperform a random portfolio.
Some of our recent blogs called into question “manager selection” alpha. Namely, that manager performance is not persistent and indexation strategies offered attractive alternatives to active allocation strategies in recent years (Elusive Persistence, Indexing Can Outperform Searching For Tail Risk Alpha, Long Time Allocators Remember When Fund Picking Worked, But It Is Possible Those Days Are In The Rearview). The analysis in those works focused mainly on “manager selection” alpha. So, we wanted to evaluate the other commonly referenced alpha generators more broadly.
In short, our initial conclusions remain valid upon further analysis. Active allocation strategies struggle to outperform a randomly selected portfolio of funds on a long-term basis. The data indicates that in pursuit of outperformance allocators may even be making riskier decisions.
Allocators’ Return Distributions Closely Match Random Selection
If active portfolio construction strategies outperformed random chance, their return distribution should have a higher mean and/or lower variance (i.e. a higher sharpe ratio) than a randomly selected portfolio of funds. Instead, we observed the distribution of gross Fund of Funds’ monthly returns (a proxy for allocators’ returns) and the distribution of 1000 equally-weighted portfolios of 25 random funds’ monthly returns appear remarkably similar. The most notable difference between the two is the tail width – actively managed portfolios have “fatter” tails. These tails imply elevated risk; that is, sometimes active allocation substantially outperforms random selection, but it also substantially underperforms almost as frequently.

Source: Unlimited Calculations
Return distributions represent only part of the story – we also analyzed the distribution of the realized 5-year Sharpe ratios (i.e. the ratio of historical average annualized return to annualized volatility) for both fund of funds and the random chance portfolios to better understand how these allocators’ returns generate the fat tails. This analysis yielded similar conclusions. Allocators appear to take riskier bets within their portfolios, which in some cases generates outsized profits, but equally many underperform.
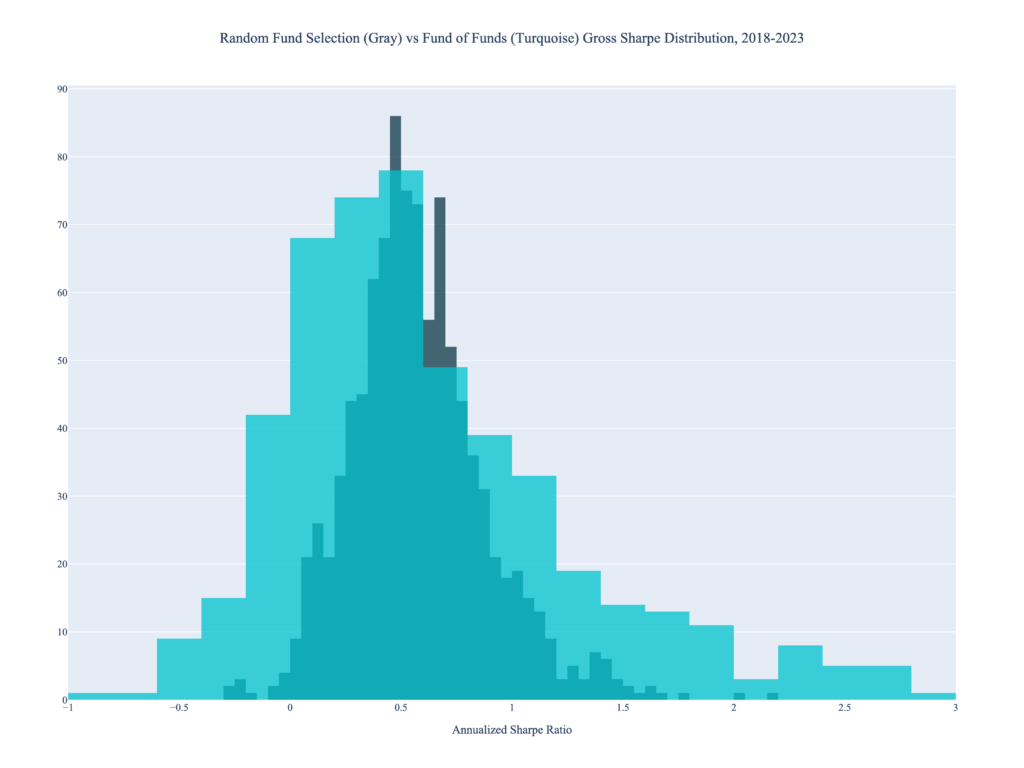
Source: Unlimited Calculations, Preqin
Note: Sharpe ratios are calculated by taking the 5-year cumulative return, de-annualizing it to monthly returns, dividing this return by the realized standard deviation of monthly returns over the same period, and then annualizing this ratio. Portfolios that end the period with a negative cumulative return will have a negative Sharpe ratio.
Perhaps the most sought after characteristic of a portfolio is alpha. Options to access Beta (and other known risk-premia) are relatively inexpensive due to the popularity of index funds and “smart beta” strategies. So are allocators generating differentiated returns with the hedge fund portfolios or are they capturing risk premia rather inefficiently? The data overwhelmingly indicates the latter. Fund of funds’ monthly Fama-French five-factor alpha (i.e., the excess gross return generated by a fund of funds’ portfolio after adjusting for the five Fama-French factors) is generally lower than that of the randomly generated portfolio with “fatter tails.” In some cases alpha is below 0, implying that allocators are either: a) taking alpha-generative assets and combining them in such a way that minimizes the alpha or b) getting tricked into picking funds that just repackage the five factors. Regardless, allocators appear to be getting the short-end of the stick.
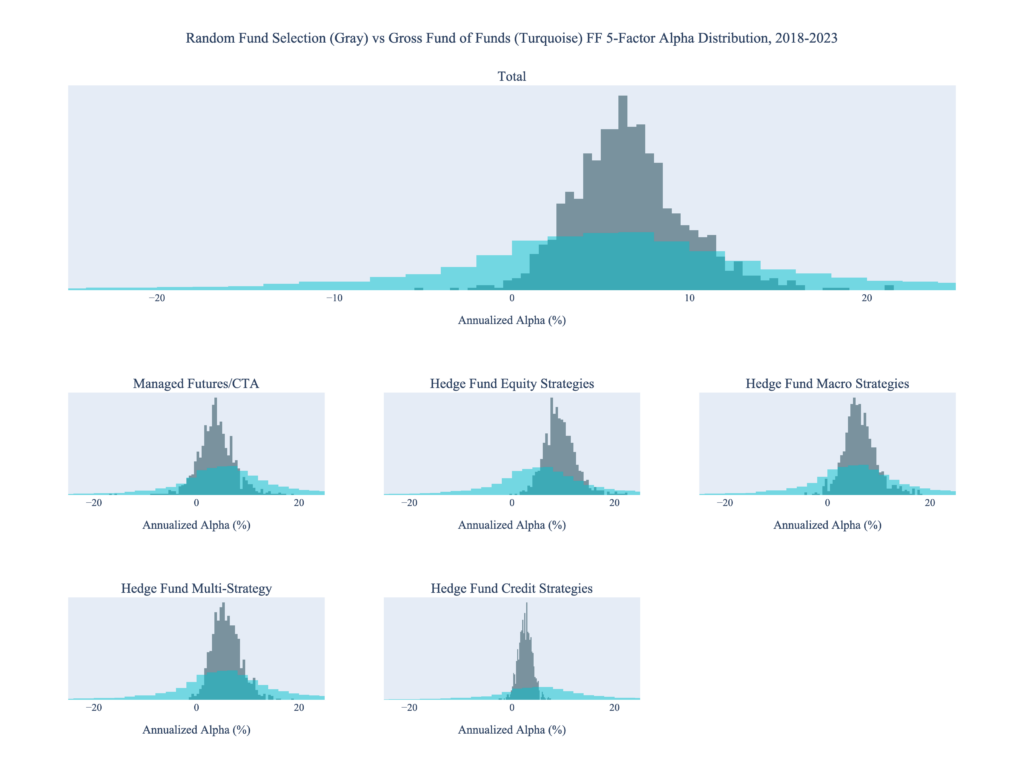
Source: Unlimited Calculations, Ken French’s Data Library, Preqin
In Markets, the Tortoise Beats the Hare
Compound growth is the key to absolute return strategies’ success. In bull markets, absolute strategies generally underperform the market, but, throughout a cycle, their consistency theoretically helps drive outperformance. This logic translates effectively to asset allocation. Consistent portfolio returns compound year-over-year to help outperform the occasional “great year.” The below, shows the cumulative performance of the average fund of funds and the cumulative performance of a randomly selected portfolio (and top/bottom quartile). It appears that the consistency of the average random portfolio allocation allows it to outperform the average active allocation over time.
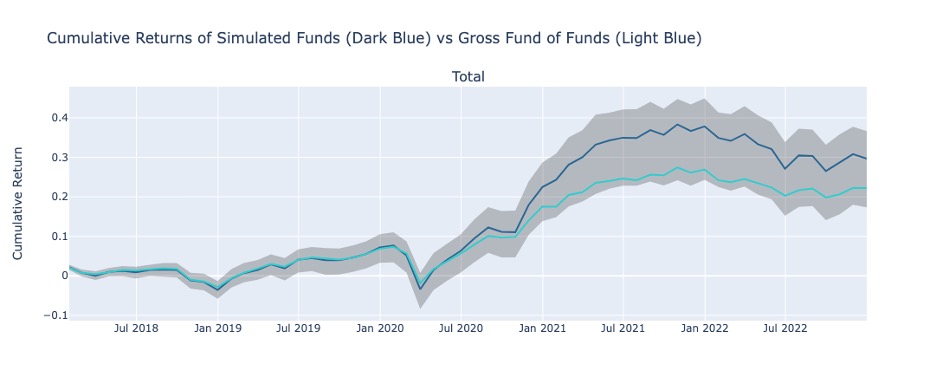
Source: Unlimited Calculations, Preqin
“Allocation” alpha is uncertain, but “fee” alpha isn’t
The data supports that historically randomized asset allocations (a proxy for indexation strategies) have tended to perform at least as well as active selection. Even for allocators that consistently fall on the right tail of the above distributions (or above the gray in the above chart), the effort is significant and that outperformance can easily disappear with a few bad months. It would be challenging for allocators to “move the needle” through active management alone since indexation strategies seem to perform comparably. Adding to their value proposition indexation strategies tend to offer another benefit – lower fees. By lowering fees, allocators could materially increase their fund performance without taking extra risk. With the three levers in mind, the case for indexation seems strong: indexation can offer a lower fee burden and, an attractive return over the long term, without the challenges of individual manager selection. Since 2019, indexation has outperformed a basic actively managed strategy by ~20%, excluding the fee benefits. So why haven’t more allocators embraced alpha indexation? Historically, that may have been driven by a lack of accessible products in the market, but that has changed. It might be time for allocators to take another look.
Note: In addition to the the distribution of gross Fund of Funds’ monthly returns (a proxy for allocators’ returns) and the distribution of 1000 equally-weighted portfolios of 25 random funds’ monthly returns, we also simulated portfolios of 10 funds and 50 funds to account for the variance across allocators’ fund count. Our results were similar, so we have omitted them for brevity.
For informational and educational purposes only and should not be construed as investment advice. The historical analysis discussed herein has been selected solely to provide information on the development of the research and investment process and style of Unlimited. It does not constitute an offer to sell or a solicitation of an offer to buy any security. Opinions expressed are our present opinions only. No Representation is being made that any investment will or is likely to achieve profits or losses similar to those shown herein. No investment strategy or risk management technique can guarantee return or eliminate risk in any market environment. The material is based upon information which we consider reliable, but we do not represent that such information is accurate or complete, and it should not be relied upon as such. The historical analysis should not be construed as an indicator of the future performance of any investment vehicle that Unlimited manages.